Global markets·Professional research·One workspace
Understand what's moving markets — and why.
Research markets, discover investment opportunities, and build portfolios with confidence.
FREE TO EXPLORE — NO CARD REQUIRED
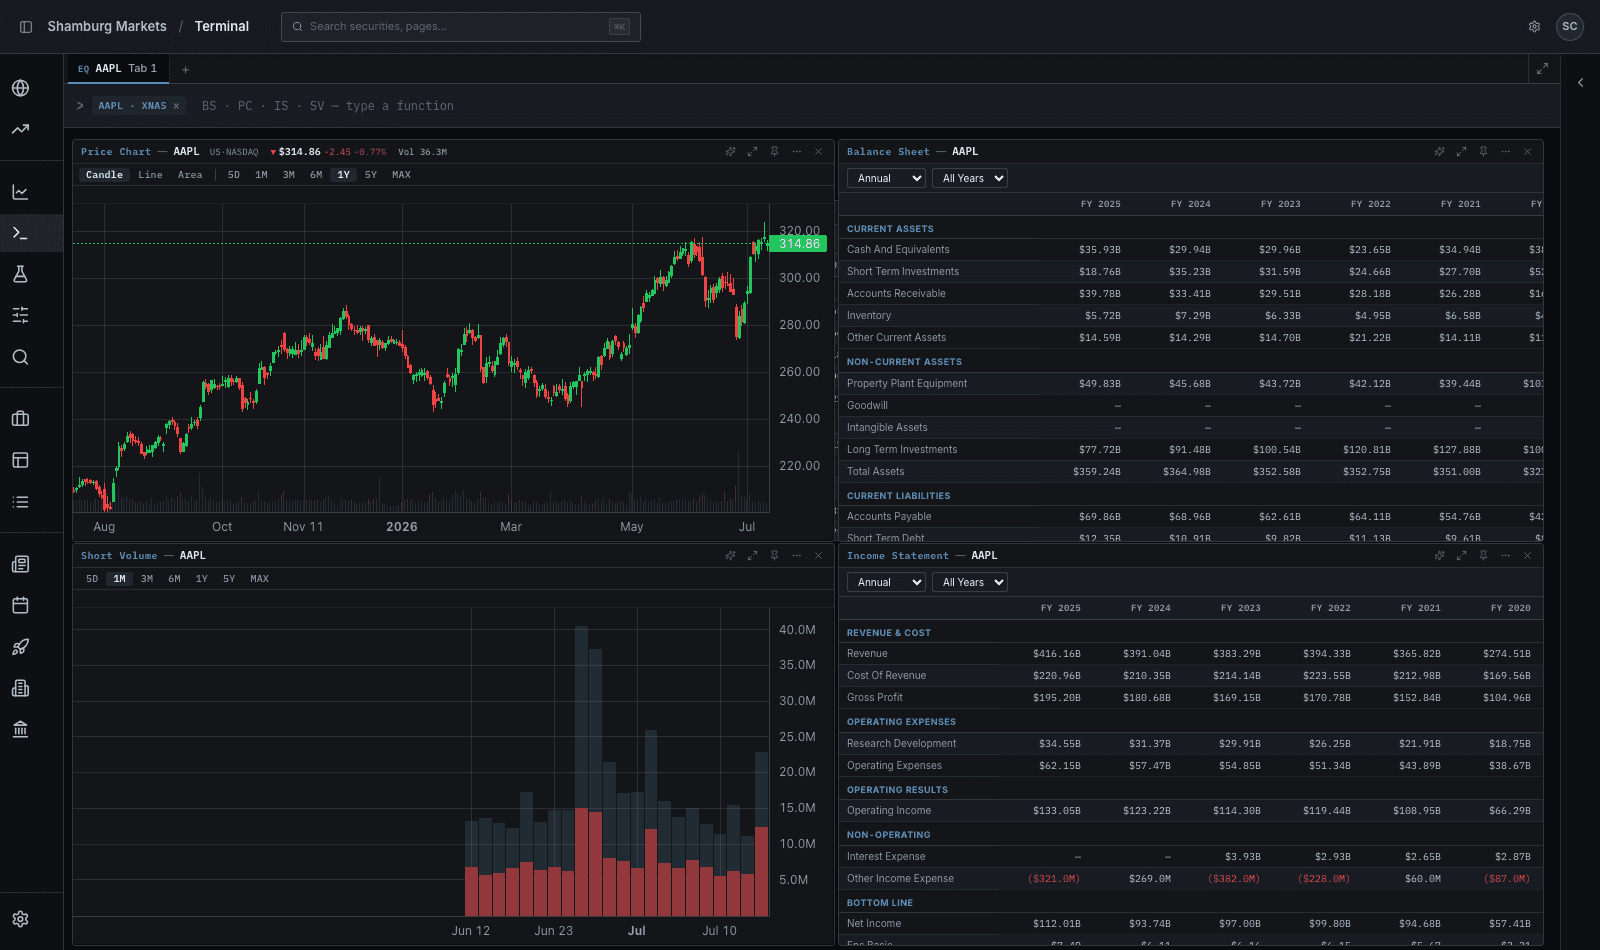
Built for investment professionals.
Analysts & researchers
Do the analysis, not the assembly.
Screen global markets in seconds, dive into historical datasets, and accelerate complex research with AI-assisted analysis.
Portfolio managers
Manage the whole book.
Monitor, compare, and optimize portfolios. Understand the exposures, drivers, and risks behind every position.
Advisors
Turn research into client confidence.
Support every recommendation with institutional-grade research and transparent evidence that helps clients understand the “why” behind every decision.
Developers
Build with data you can trust.
The same normalized data that powers Shamburg Markets, over one REST API, built for investment platforms, research tools, and financial applications.
See the market from every angle.
Shamburg Markets connects the macro backdrop, sector rotation, company fundamentals, ownership, and filings in one workspace, so you can examine any move from every angle, all the way down to its source.
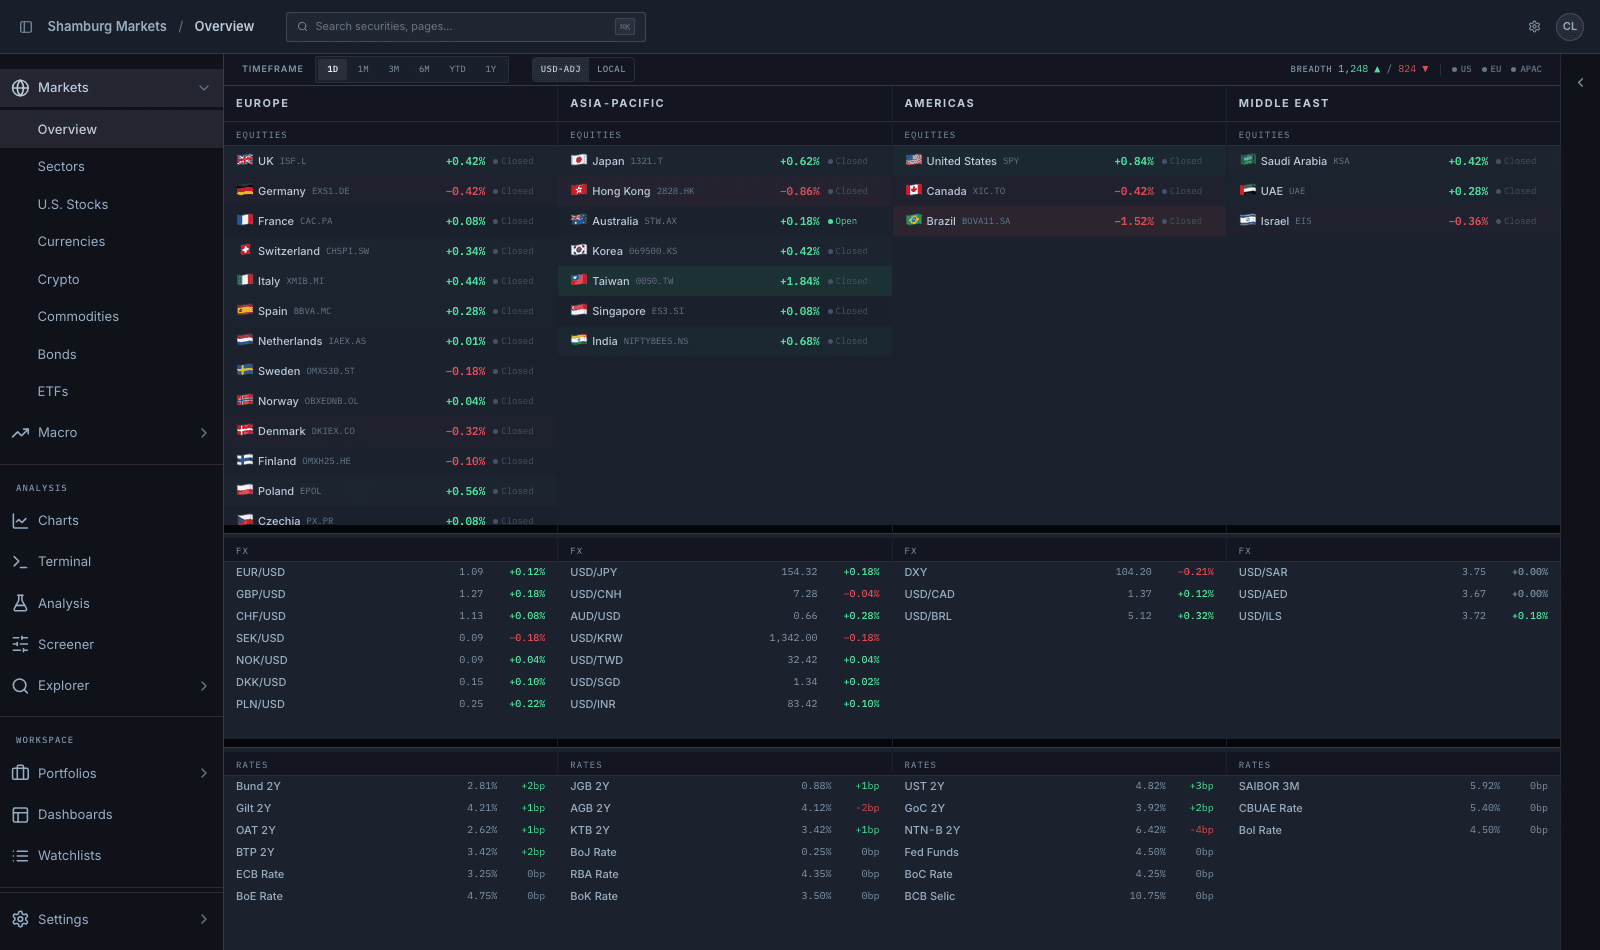
The whole market, side by side
Compare movements across asset classes, regions, and rates in one view. Spot what's leading, what's lagging, and what's diverging at a glance.
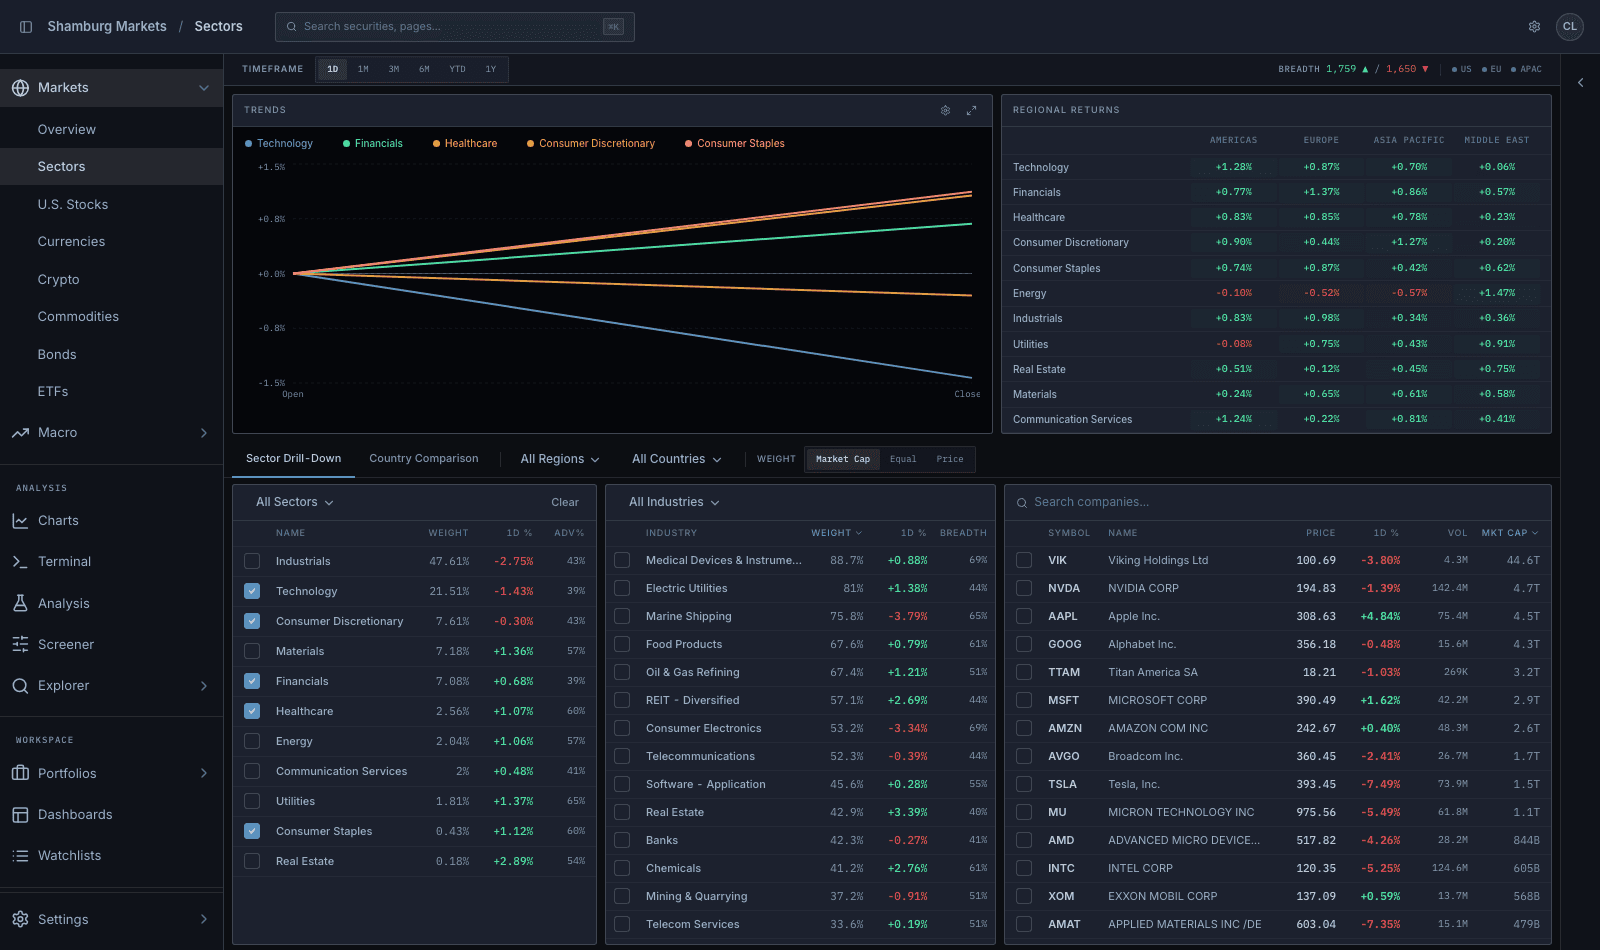
The drivers behind the move
Trace market strength through sector rotation, industry leadership, and breadth, down to the individual companies driving the move.
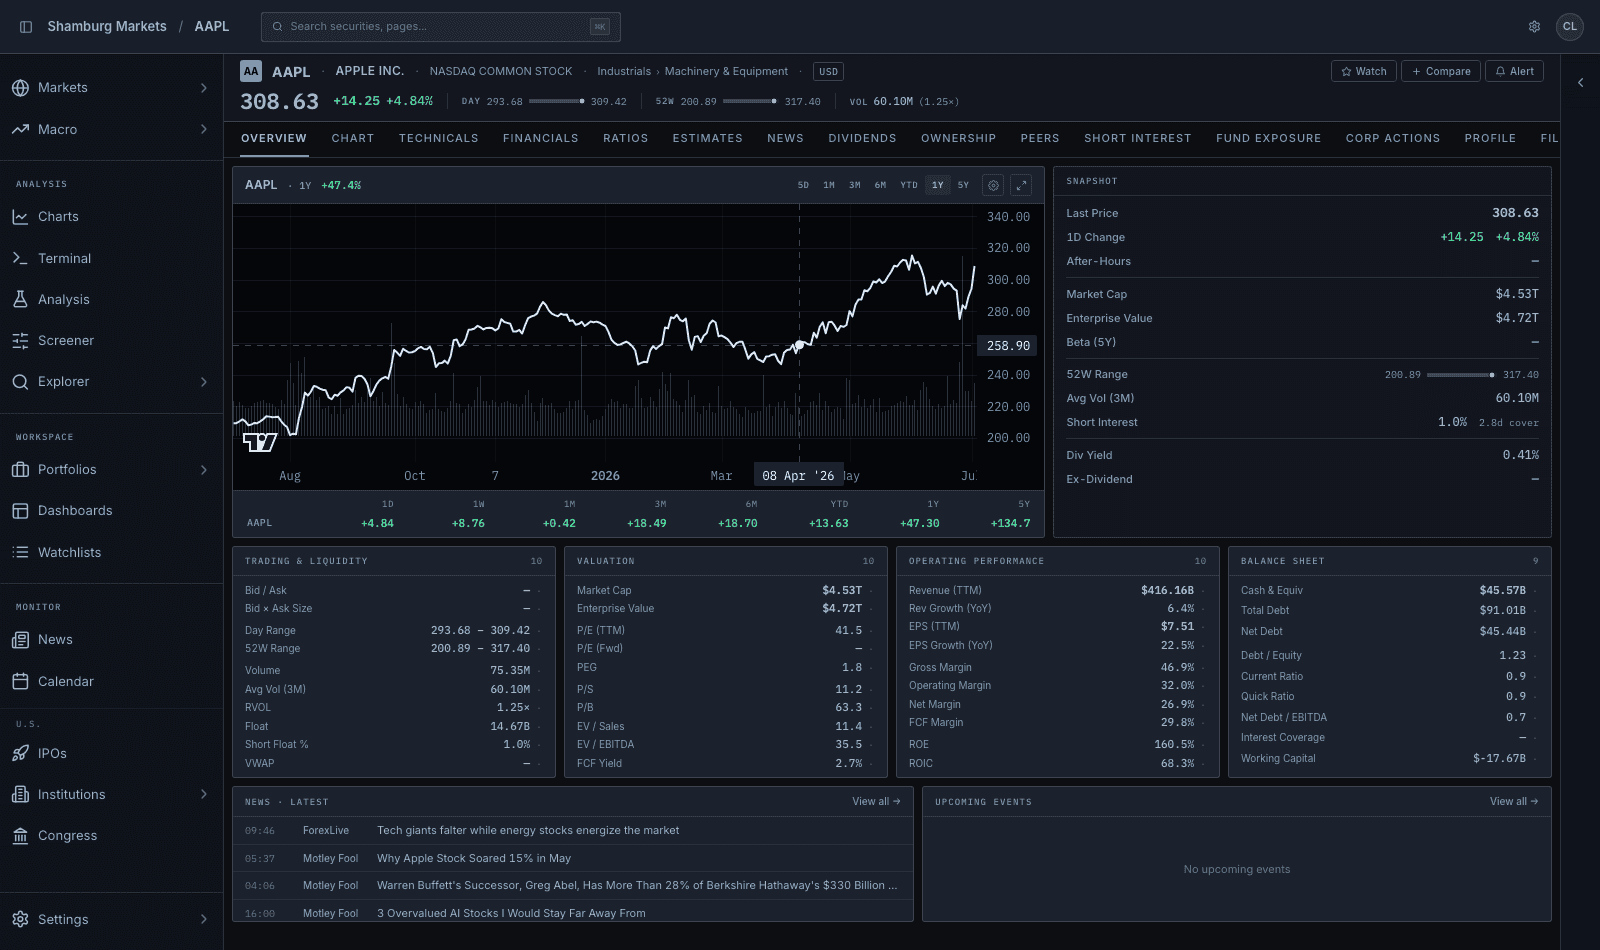
Security analysis, complete
Fifteen views on every company: chart, financials, 70+ ratios, ownership, short interest, and the filings behind them, all without leaving the page.
The macro backdrop, term by term
Analyze yields, spreads, and term structure across major economies.
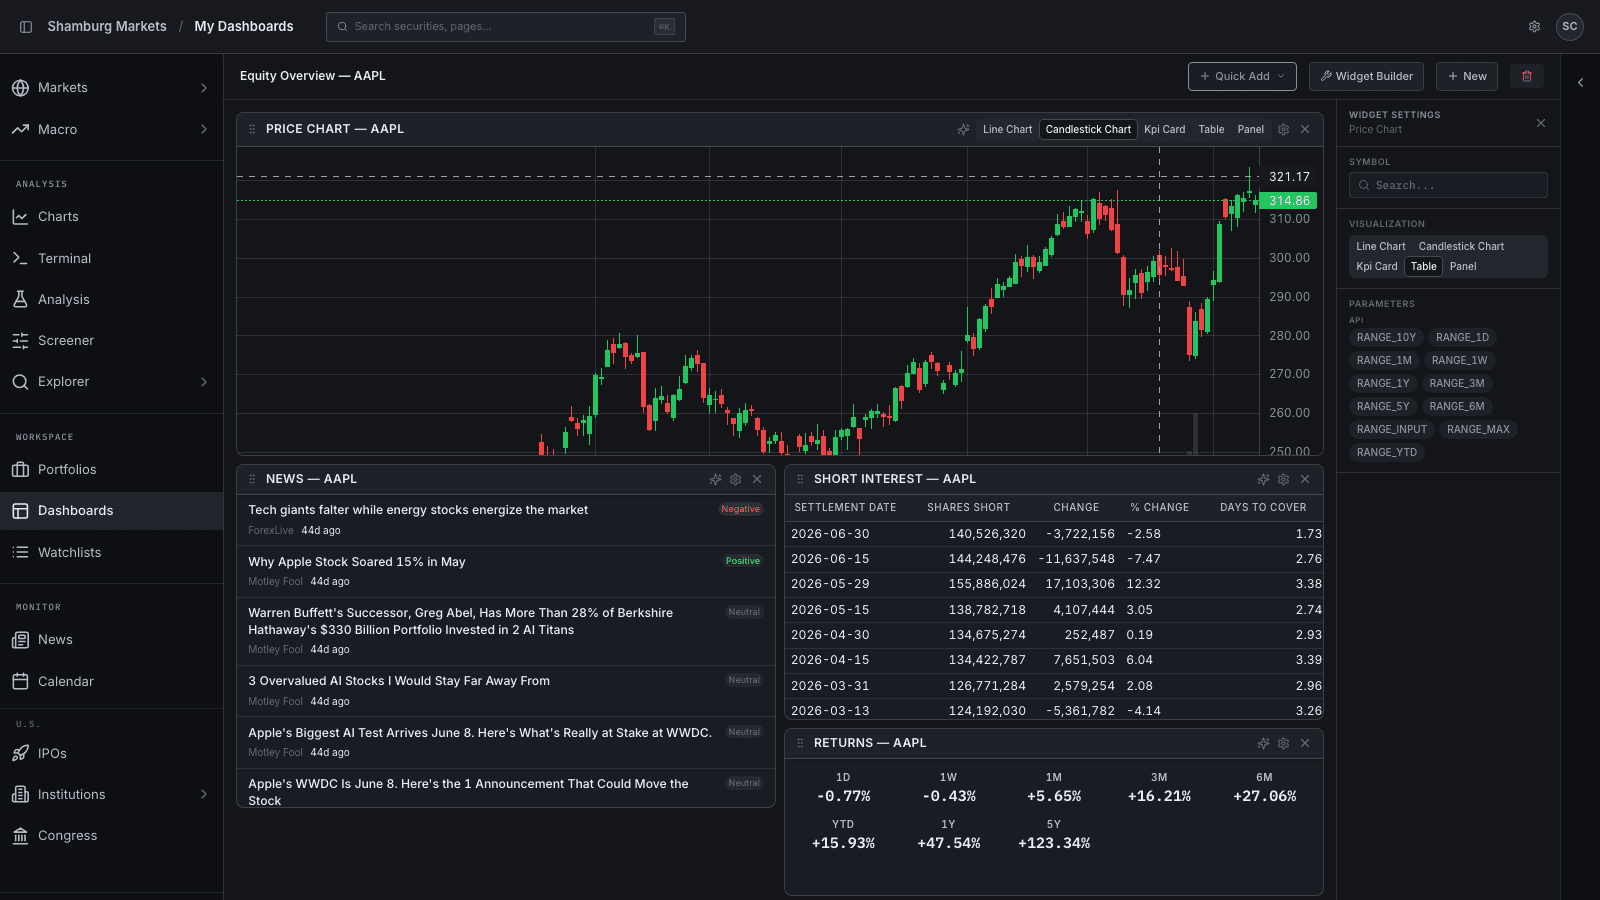
A workspace you compose
Pick a security, choose a visualization, and pull from the full data catalog to build the exact view your analysis needs.
Your portfolio, connected
Construct portfolios, monitor performance and exposure, and drill from any position straight into the research behind it.
The full platform
Dozens more dashboards, datasets, and tools ship with the platform. See them all in one place.
Workspace + API
One platform. Two ways to build.
Market workspace
Analyze in the browser
The full analytical workspace runs in the browser, no install. Everything above, plus charting, screeners, news, and alerts, behind one login.
Open the appDeveloper API
The same data, over REST
The datasets behind every page above, normalized and versioned, for research, applications, and internal tools.
$ curl "https://api.shamburgmarkets.com/v1/dividends/AAPL/metrics" \
    -H "Authorization: Bearer $SHAMBURG_API_KEY"

{ "data": [{ "dividend_yield": 0.41, "payout_ratio": 14.6, … }],
  "meta": { "identifier": { "requested": "AAPL", … } } }
Explore the developer platform ↗Pricing
Explore free. Go deep for less than a data feed.
Free
NO CARD REQUIRED
- Explore every page of the platform
- Core market, company, and news data
- One watchlist and one portfolio
Dashboard
OR $59 MONTH-TO-MONTH
- Full analytical workspace — every dashboard, every market
- Advanced charting, screeners, and the terminal workstation
- AI-assisted research and analysis
- Unlimited portfolios, watchlists, alerts, and custom dashboards
Need team access, enterprise data, or custom licensing? Talk to us
Building with the API? See developer pricing. Cancel anytime from your billing settings.